Free Break-Even Calculator
Calculate break-even point, revenue target, and margin per unit. Visual chart included. 100% in your browser.
How It Works
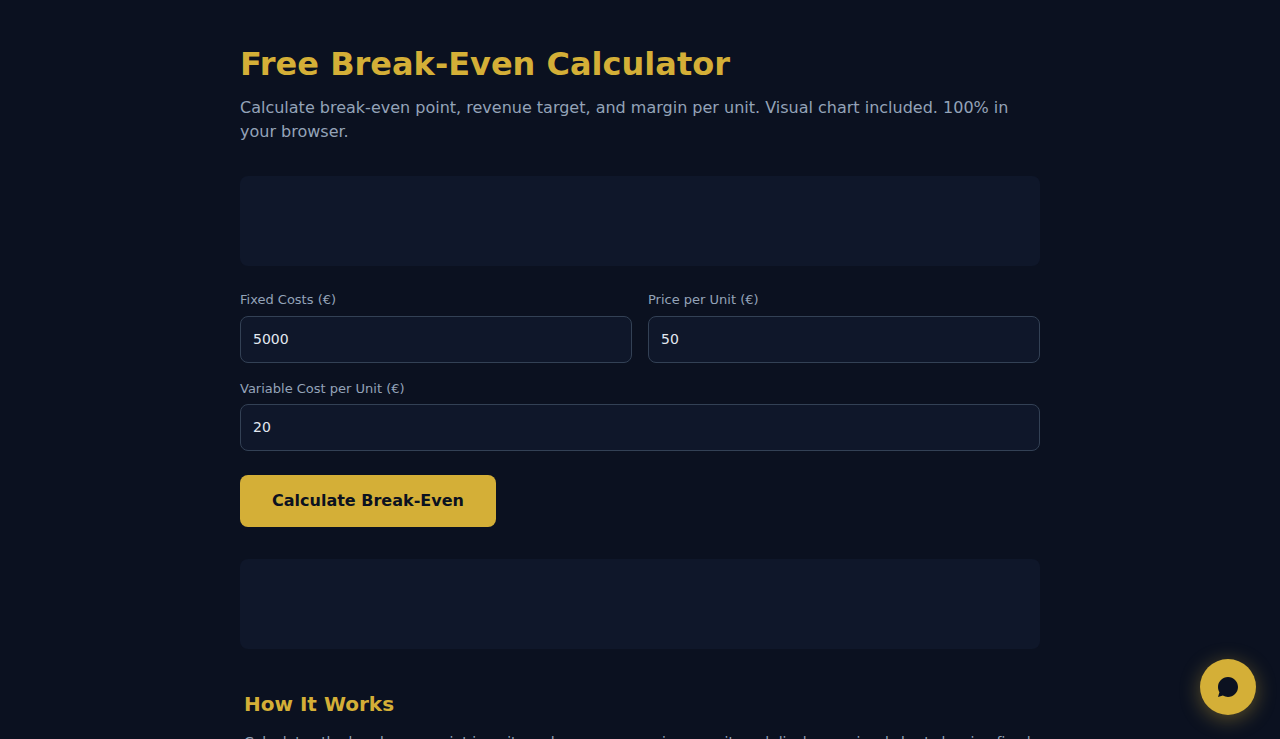
Calculates the break-even point in units and revenue, margin per unit, and displays a visual chart showing fixed costs, total costs, and revenue lines. Enter fixed costs, price per unit, and variable cost to see exactly where your business transitions from loss to profit.
When to Use It
- Setting product prices by understanding how many units cover all costs.
- Evaluating business viability before launching a new product line.
- Creating financial presentations showing where profit begins.
Frequently Asked Questions
What inputs do I need?
Three numbers: total fixed costs (rent, salaries), price per unit, and variable cost per unit (materials, shipping). The tool calculates units needed for revenue to equal total costs.
How do I read the chart?
Three lines: fixed costs (horizontal), total costs (rising), and revenue (steeper). Where revenue crosses total costs is break-even. Everything right of that is profit.
What if variable cost exceeds price?
Break-even is impossible — you lose money on every unit. Increase price, reduce costs, or redesign your model before proceeding.
All calculations happen in your browser. No data is sent to any server.
These tools are free forever. SARA takes it further.
SARA is your AI agent on WhatsApp: answers customers, takes bookings, follows up — 24/7, automatically. Try it free for 14 days.
Start your free 14-day trial →