💰 Quick Win
Process Analyzer
How to Use Flowcharts for Business Process Analysis
⏱️ 4 min read
In 2026, streamlining operations is no longer optional; it’s survival. With 62% of SMBs struggling with inefficient processes, the ability to analyze and optimize workflows is critical. Flowcharts offer a simple yet powerful method to visualize and improve your business processes, leading to increased efficiency and profitability.
Understanding Flowcharts for Business Process Analysis
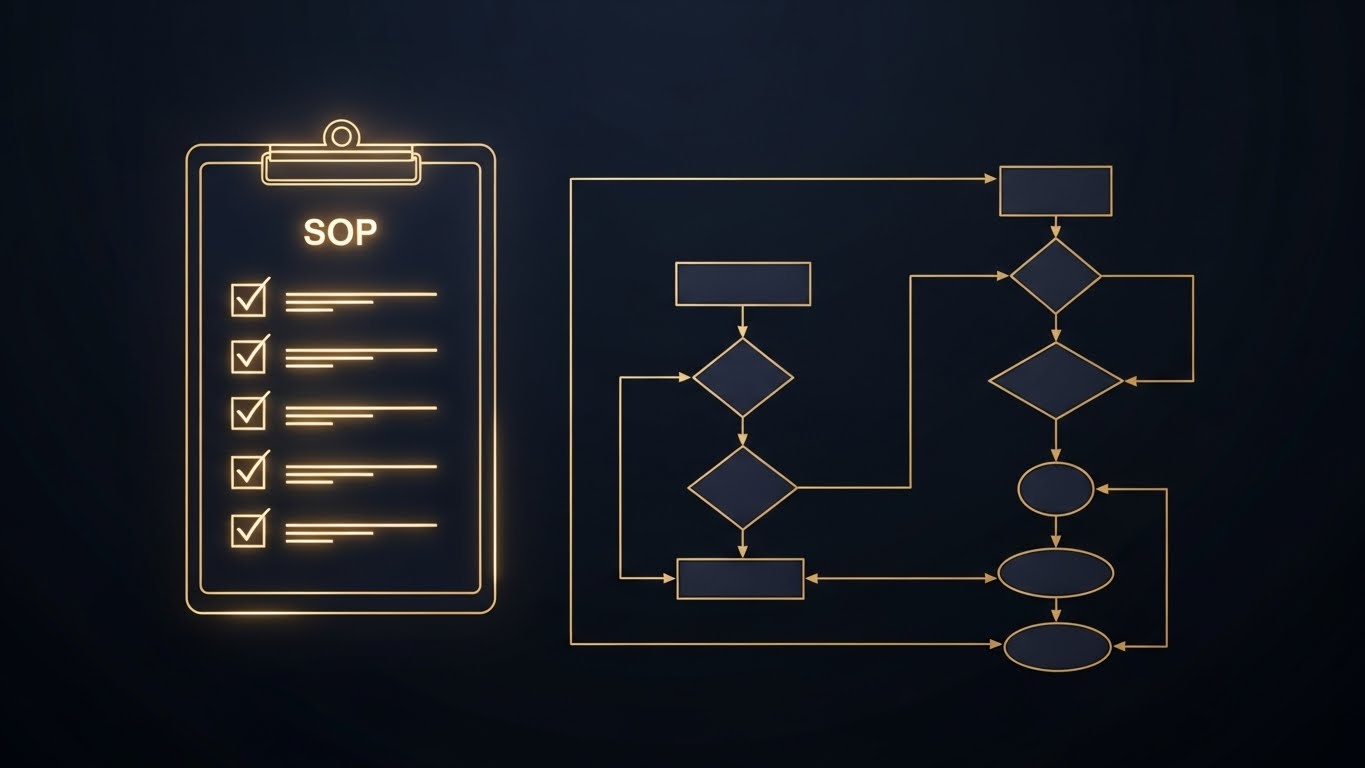
A flowchart is a diagram that visually represents a process, using symbols to depict steps, decisions, and inputs/outputs. It’s a universal language easily understood across departments, making it an ideal tool for identifying bottlenecks, redundancies, and areas for improvement. Think of it as a roadmap for your business processes, guiding you toward efficiency and optimization.
Benefits of Using Flowcharts
Flowcharts offer numerous advantages for business process analysis:
- Improved Communication: Provides a clear, visual representation of the process, facilitating understanding among team members.
- Enhanced Problem Solving: Allows for easy identification of bottlenecks, inefficiencies, and potential errors.
- Standardized Processes: Ensures consistency and adherence to best practices across the organization.
- Better Training: Serves as a visual aid for training new employees on process workflows.
- Increased Efficiency: By identifying and eliminating redundancies, flowcharts help streamline processes and improve overall efficiency. According to a recent study, businesses that actively map and analyze their processes experience an average of 15% increase in operational efficiency.
Creating Effective Flowcharts: A Step-by-Step Guide
Creating a flowchart doesn’t require advanced technical skills. Follow these steps to effectively map your business processes:
- Define the Process: Clearly identify the process you want to analyze, including its start and end points.
- Gather Information: Collect data on the process, including each step, decision points, and involved parties. Interview employees, review documentation, and observe the process in action.
- Choose Your Tools: Select a flowcharting tool. You can use traditional pen and paper, or opt for digital software like Lucidchart, Microsoft Visio, or even simpler online tools. S. C. A. L. A. AI OS integrates with many popular diagramming tools, making it easy to incorporate process maps into your automation workflows.
- Use Standard Symbols: Employ standard flowchart symbols to represent different elements of the process (e.g., rectangles for process steps, diamonds for decisions, ovals for start/end points).
- Map the Process: Draw the flowchart, connecting the symbols in the correct sequence to represent the flow of the process.
- Analyze and Improve: Once the flowchart is complete, analyze it to identify areas for improvement. Look for bottlenecks, redundancies, and opportunities for automation.
Applying Flowcharts to Different Business Areas
Flowcharts aren’t limited to manufacturing or logistics; they’re applicable across various business functions. Consider these examples:
- Customer Service: Map the customer service process from initial contact to resolution, identifying areas for faster response times and improved customer satisfaction. With AI-powered chatbots handling initial inquiries, as 45% of businesses now report, flowcharts can help optimize the handover process to human agents.
- Sales Process: Visualize the sales cycle from lead generation to closing the deal, pinpointing opportunities to shorten the sales cycle and increase conversion rates.
- Order Fulfillment: Chart the order fulfillment process from order placement to delivery, identifying bottlenecks and optimizing logistics.
- Human Resources: Map the onboarding process for new employees, ensuring a smooth and efficient integration into the company.
In 2026, integrating AI into flowcharting and process analysis is becoming commonplace. AI-powered tools can automatically generate flowcharts from process descriptions, identify inefficiencies, and even suggest optimization strategies. They can also monitor real-time process data and flag deviations from the defined flowchart, allowing for proactive intervention.
FAQ: Flowcharts and Business Process Analysis
What are the common mistakes to avoid when creating flowcharts?
Avoid excessive detail, using non-standard symbols, and failing to involve relevant stakeholders. Keep the flowchart clear, concise, and focused on the key steps of the process.
How often should I review and update my flowcharts?
Review and update your flowcharts regularly, especially when there are changes to the process or the business environment. Aim for at least quarterly reviews to ensure accuracy and relevance.
Can flowcharts be used for complex processes?
Yes, but break down complex processes into smaller, more manageable sub-processes and create separate flowcharts for each. This makes the analysis easier and more effective.
By mastering the art of flowcharting, you can unlock significant improvements in your business processes, leading to increased efficiency, reduced costs, and improved customer satisfaction. S. C. A. L. A. AI OS empowers you to take your process analysis to the next level with intelligent automation. Start your free trial today and experience the power of AI-driven process optimization at app.get-scala.com/register.
Prova S.C.A.L.A. AI OS gratis per 30 giorni
Inizia Gratis →